BIC documents
Tutorial for analyses
Across cancers
§ Bacterial abundance
For the query:
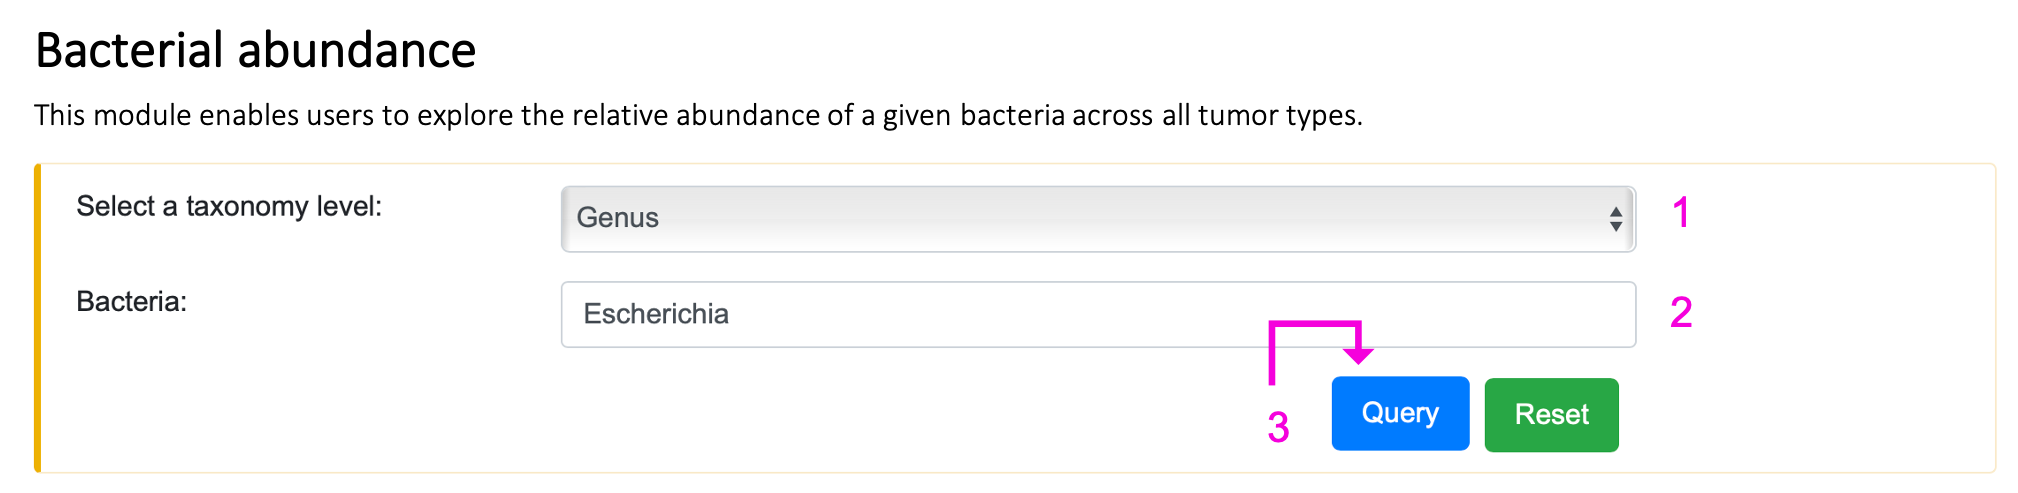
Step 1. Select the taxonomy level: Genus, Family, Order, Class, or Phylum.
Step 2. Enter the bacteria name of interest. Autocompleted name list will popup if the bacteria existed in BIC. Otherwise, "Not available" will show up on 2 after clicking the query button.
Step 3. Click "Query" to get the result part.
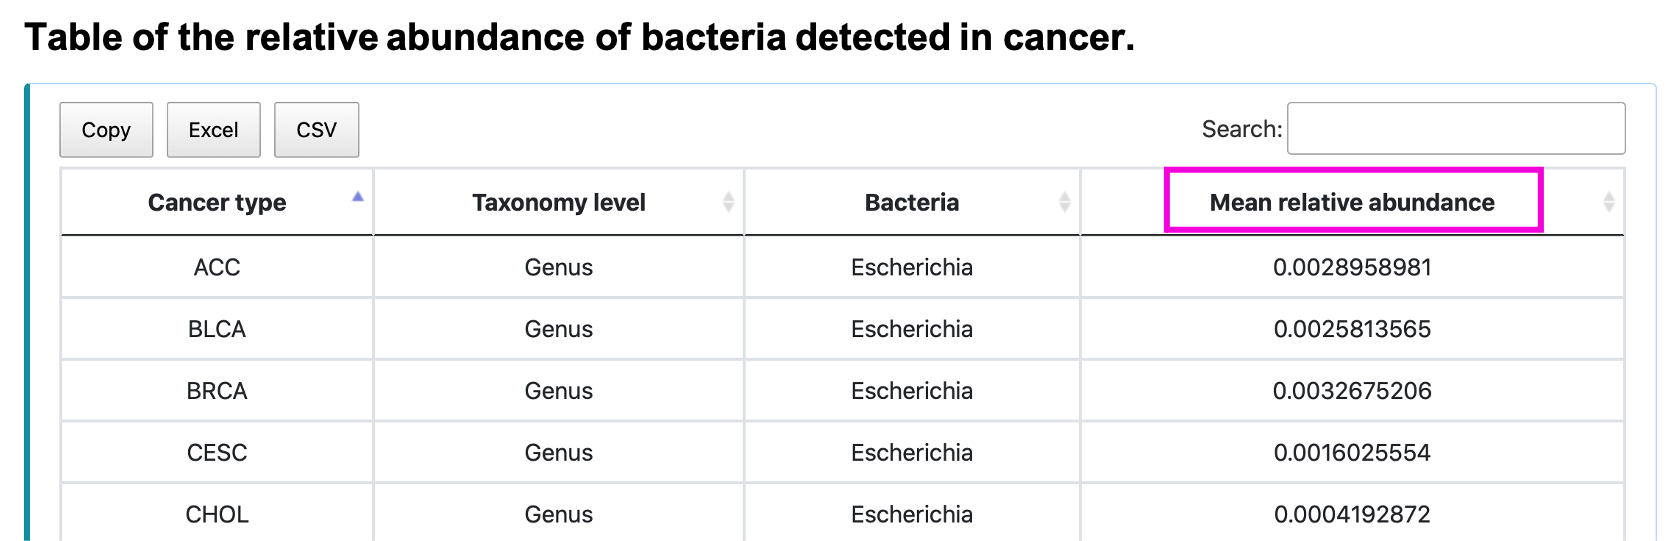
For the result:
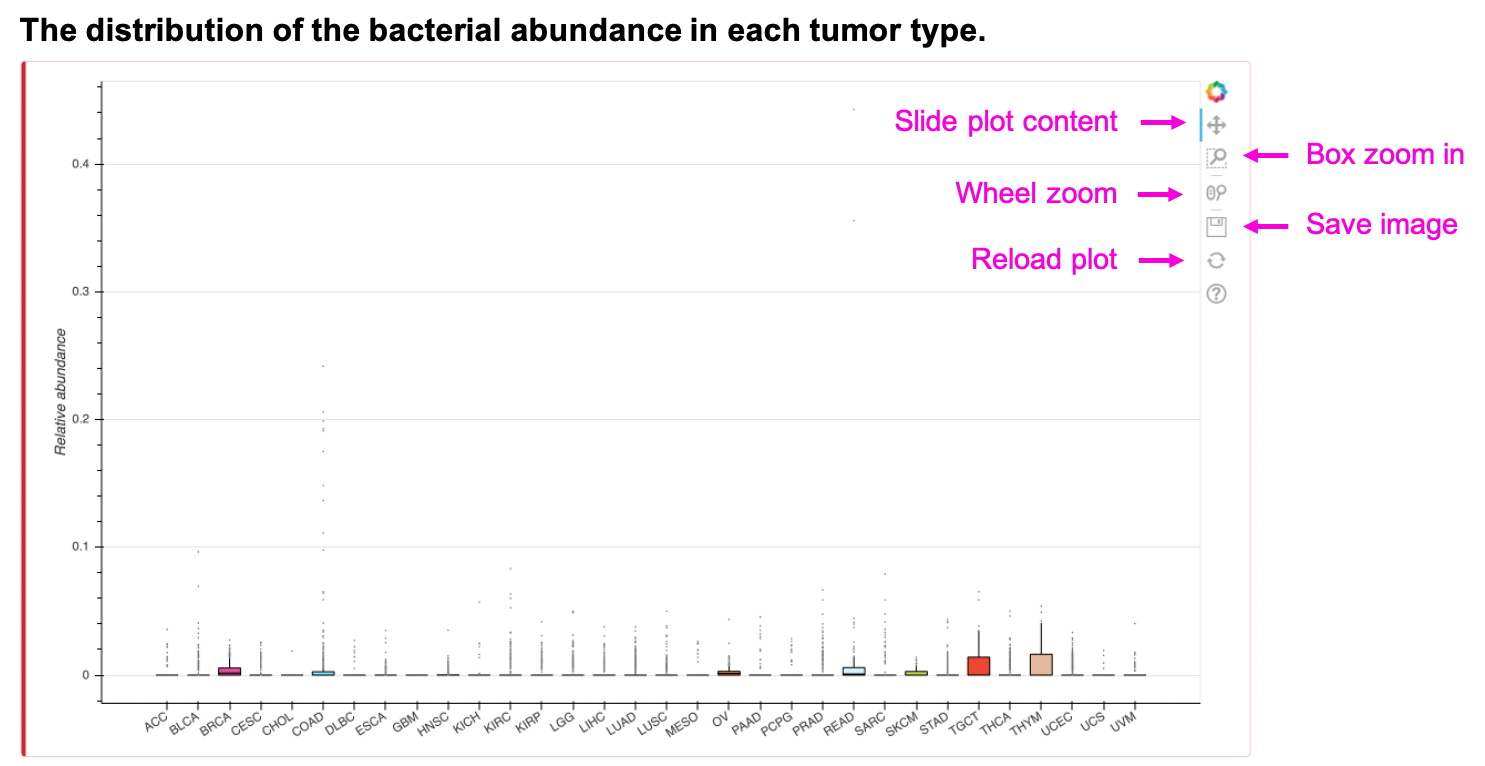
The boxplot shows the relative abundance of the input bacteria and taxonomy. Slide, zoom in, save or reload the image by clicking on the corresponding button. The table shows the mean relative abundance of input bacteria and taxonomy. Save the table by clicking Copy, Excel, or CSV button.
§ Bacterial diversity
For the query:
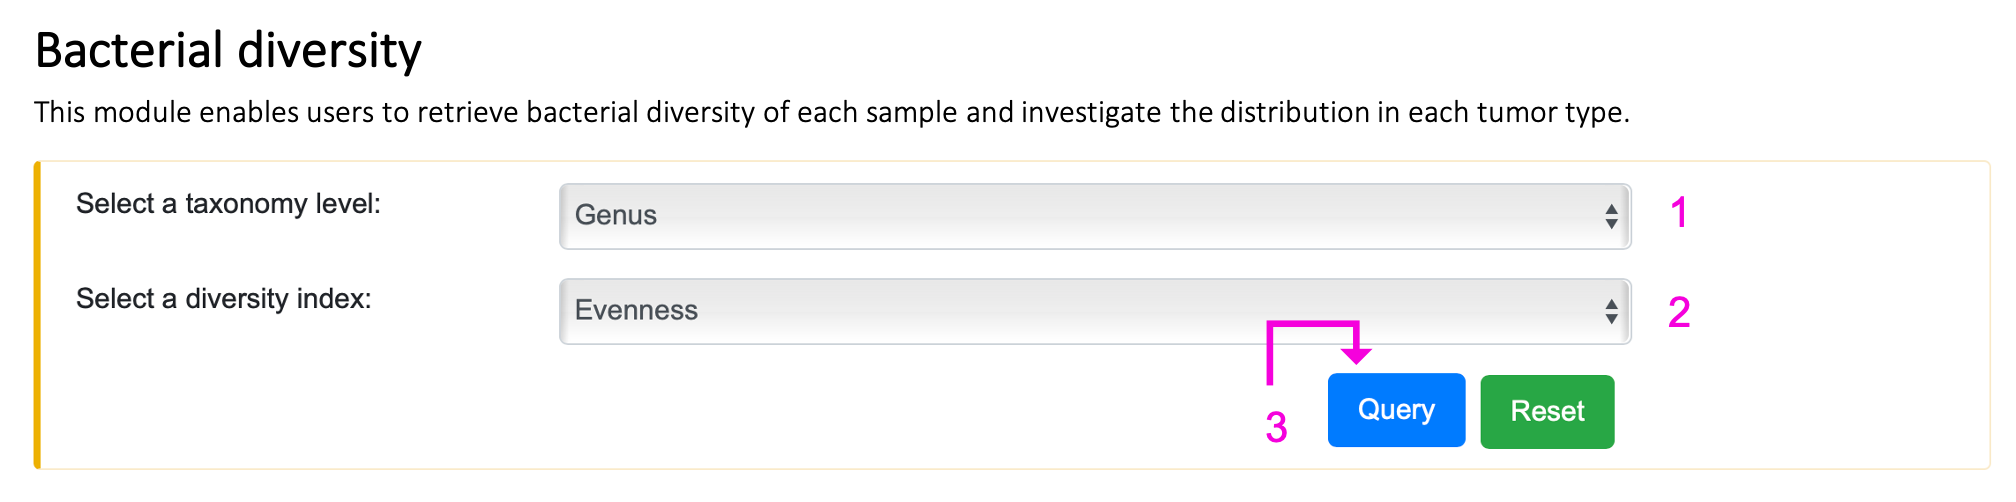
Step 1. Select the taxonomy level.
Step 2. Select the diversity index or evenness.
Step 3. Click "Query" to get the result part.
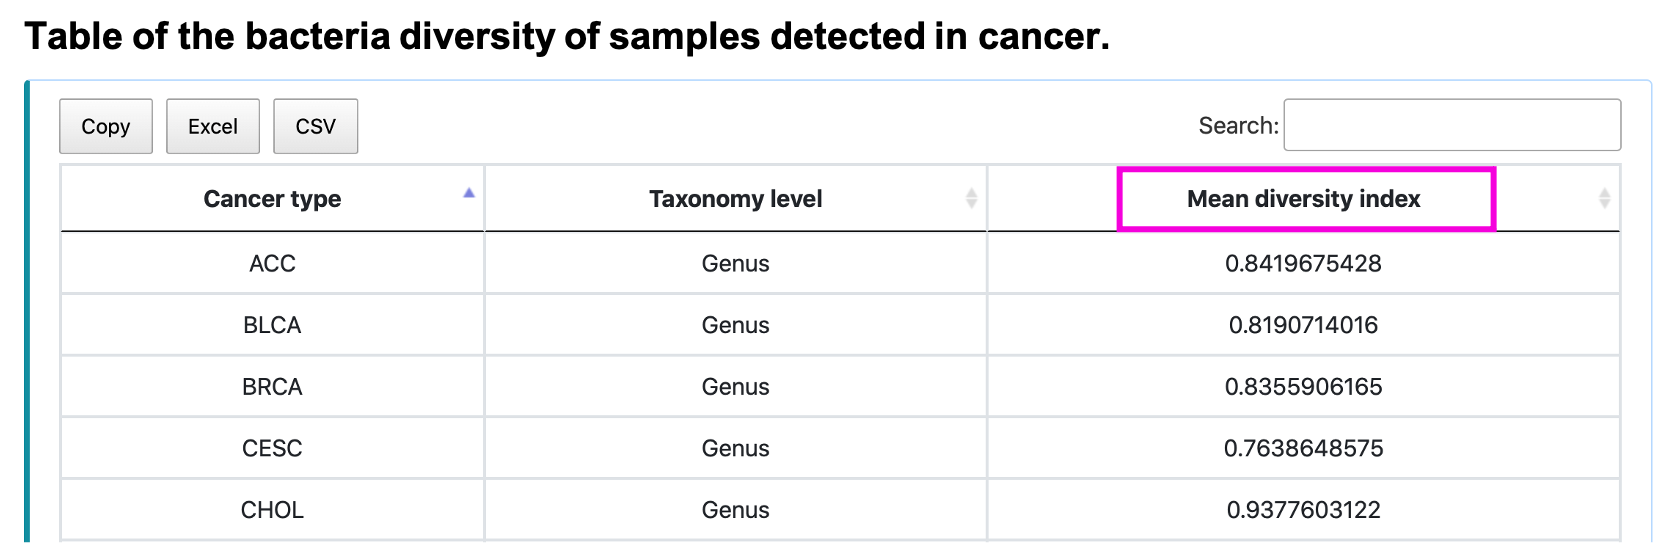
For the result:
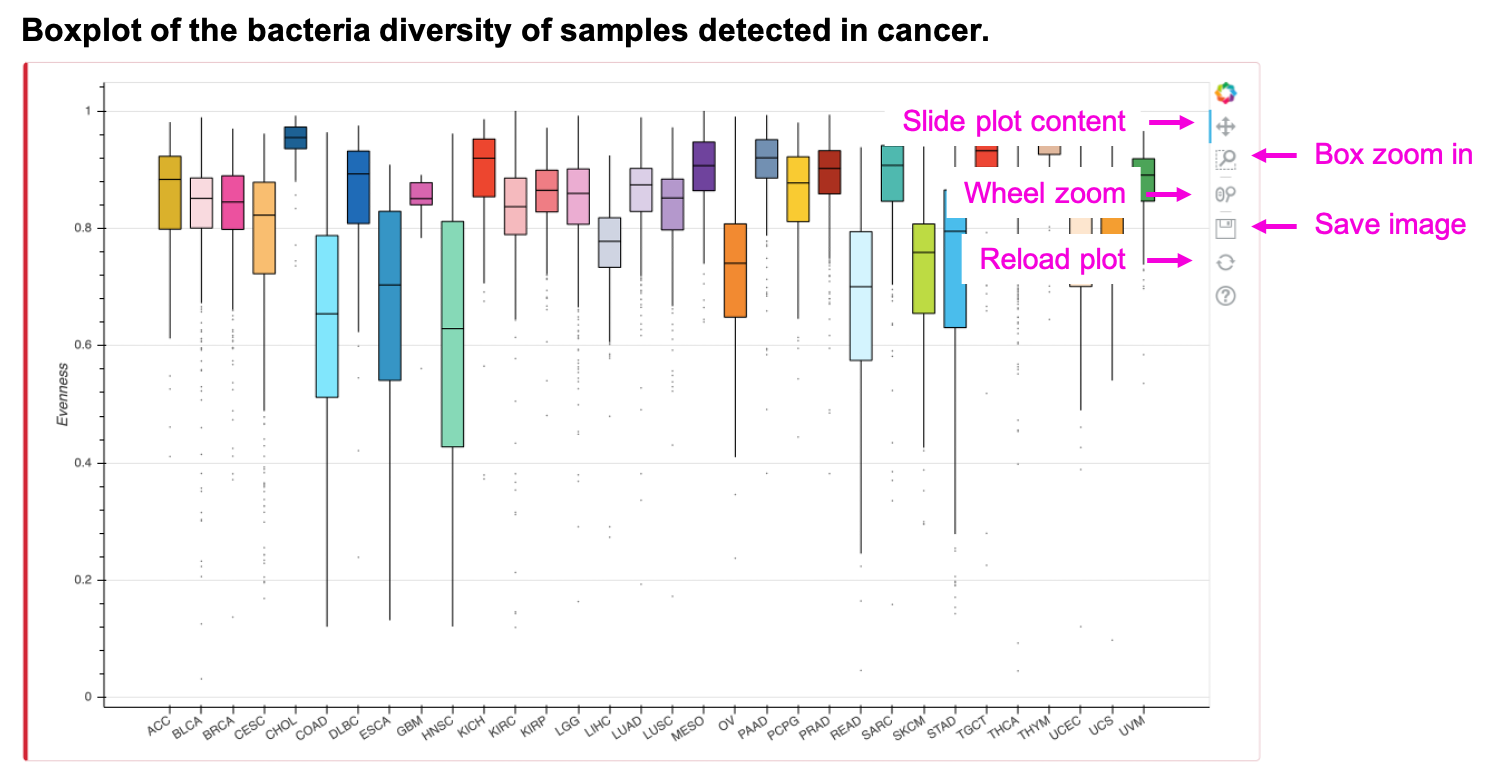
The boxplot shows the diversity index or evenness of input taxonomy. Slide, zoom in, save or reload the image by clicking the button. The table shows the mean diversity index of input taxonomy. Save the table by clicking Copy, Excel, or CSV button.
Individual cancer type
§ Bacterial composition
For the query:
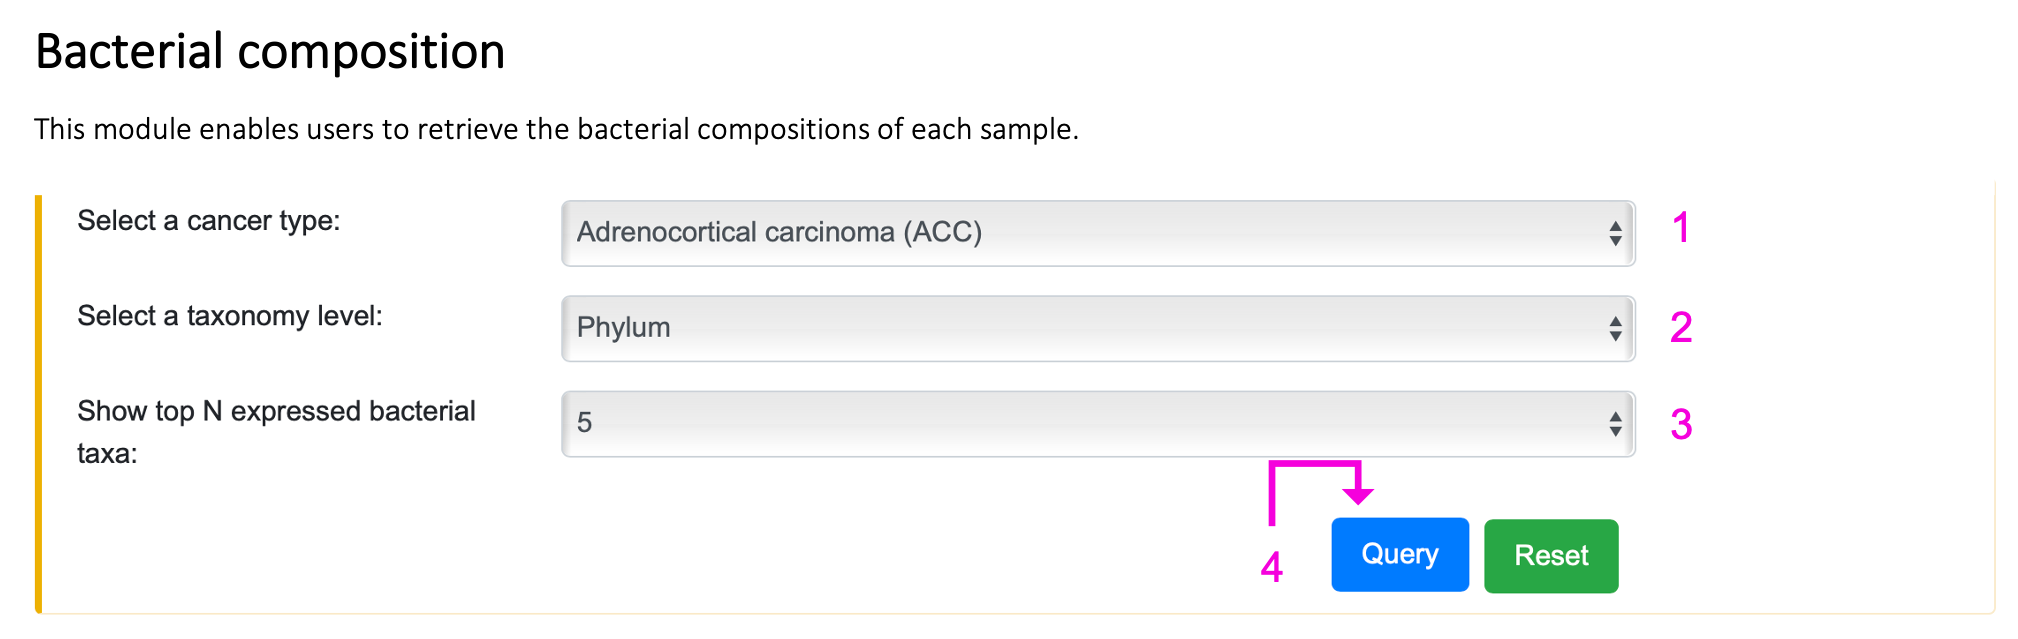
Step 1. Select the cancer type.
Step 2. Select the taxonomy level.
Step 3. Select the number of the top N abundant bacteria taxa, where N can be 5, 10, or 15.
Step 4. Click "Query" to get the result part.
For the result:
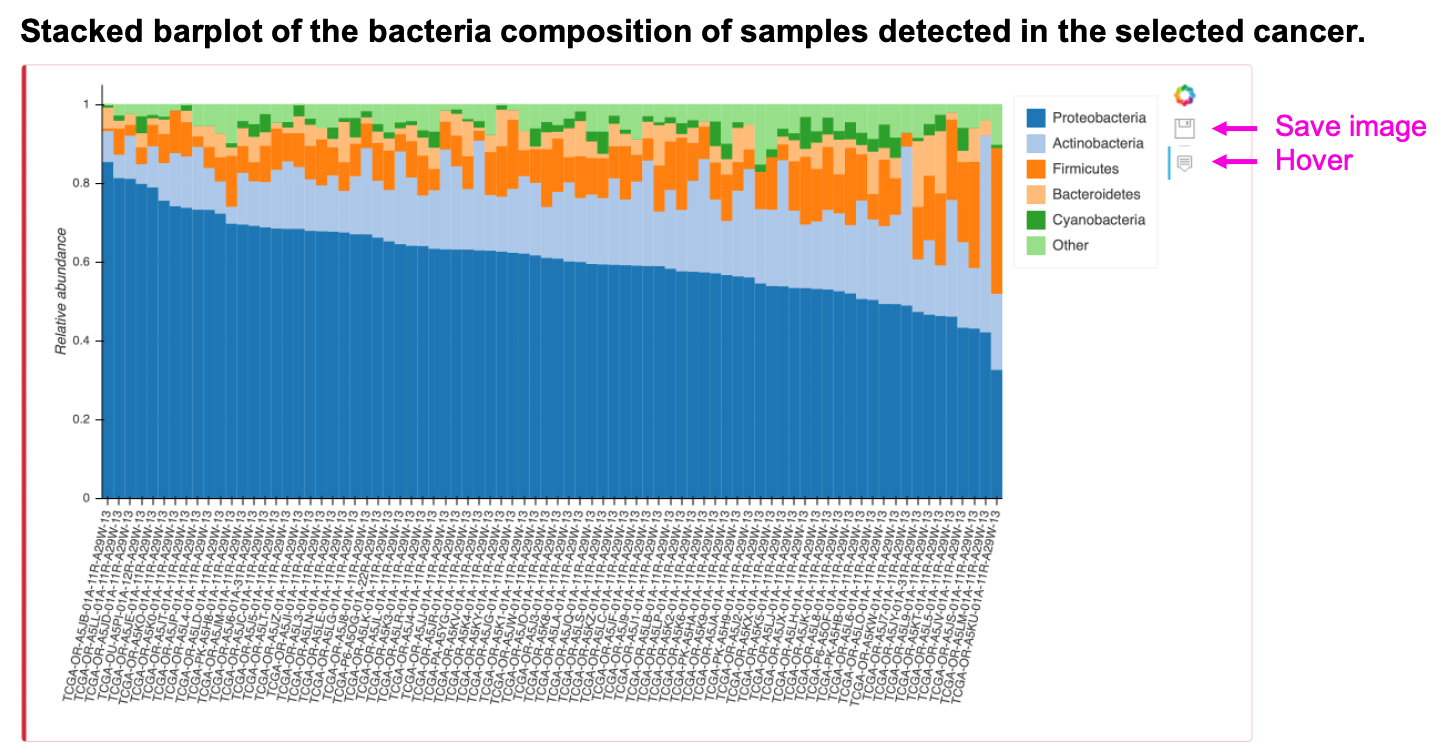
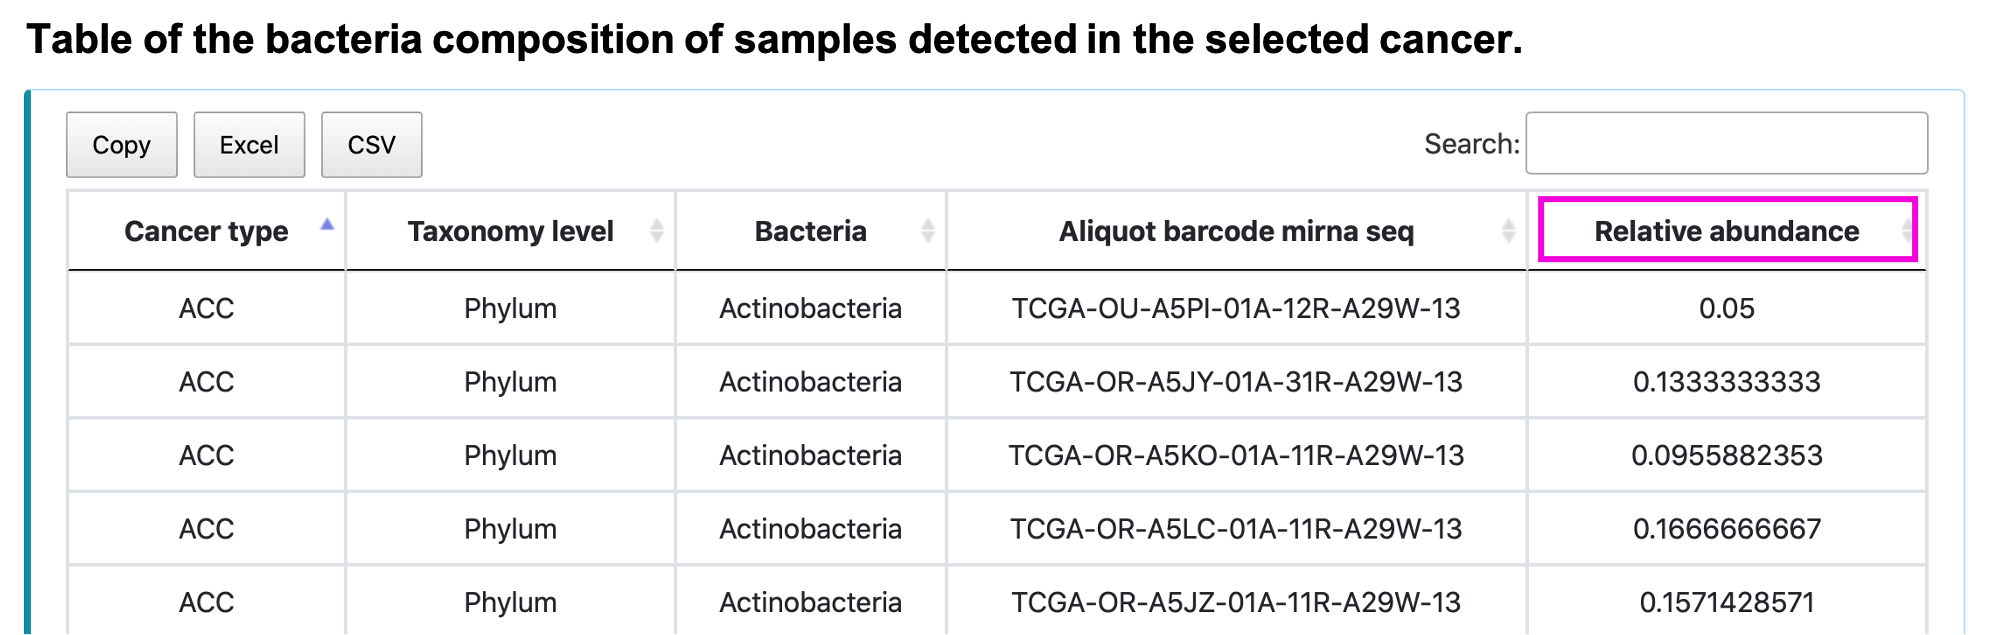
The stacked barplot shows the bacterial composition of input cancer type, taxonomy, and top N abundant taxa. The "Other" category of the plot is the summation of the remaining taxa. Save the image by clicking the save button or see the expression value of the taxa in the individual sample as the mouse hovers over the stacked barplot. The table shows the relative abundance of input cancer type and taxonomy of the particular sample. Save the table by clicking Copy, Excel, or CSV button.
§ Clinical relevance
For the query:
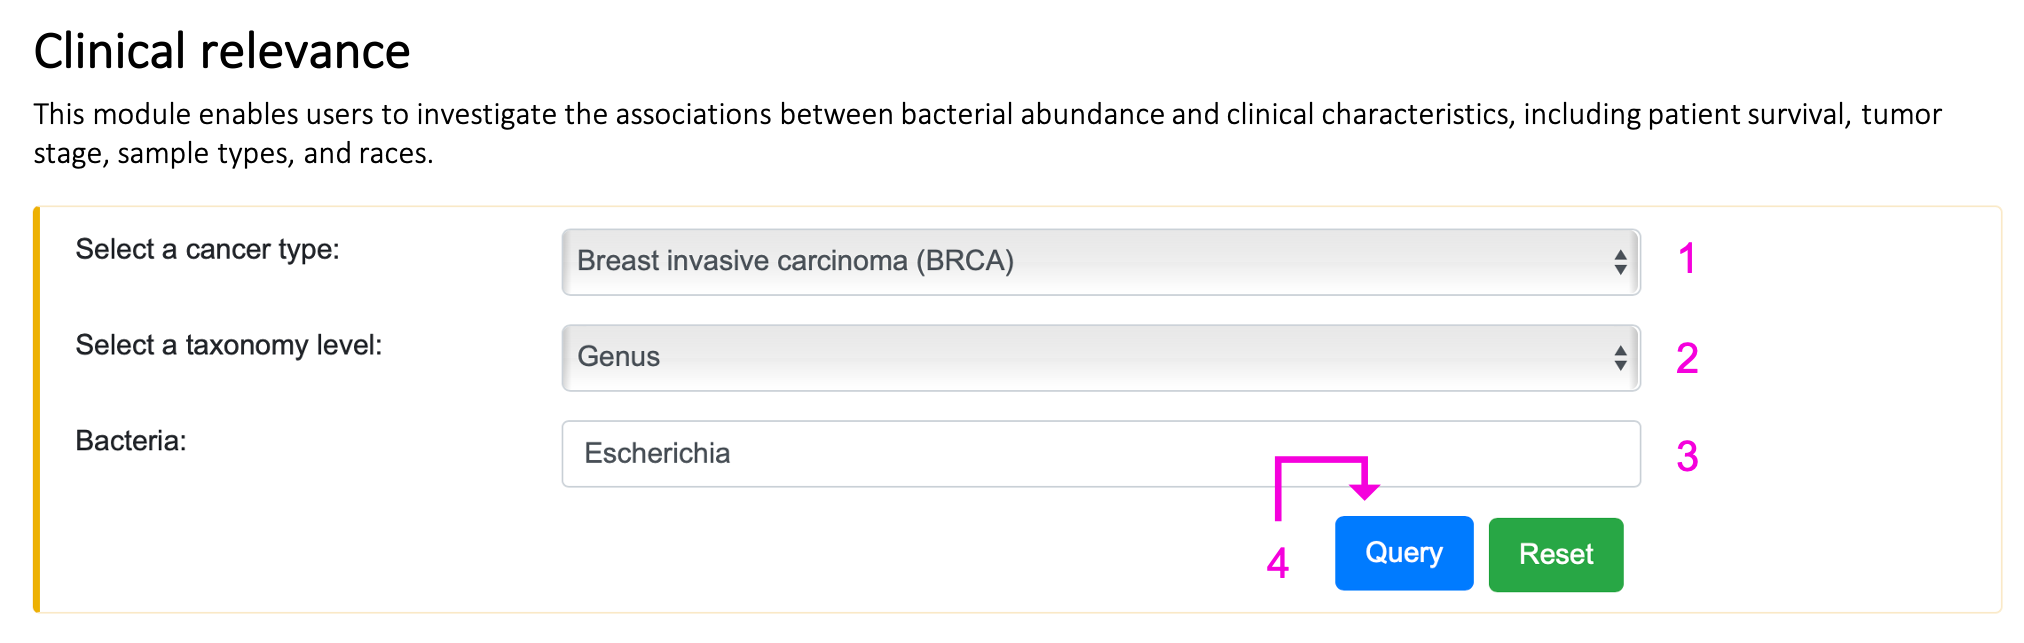
Step 1. Select the cancer type.
Step 2. Select the taxonomy level.
Step 3. Enter the bacteria name of interest. Autocompleted name list will popup if the bacteria existed in BIC. Otherwise, "Not available" will appear on 3 after clicking the query button.
Step 4. Click "Query" to get the result part.
For the result:

Figure A shows the Kaplan-Meier plot of the input bacteria, taxonomy, and cancer type. The tumor samples are separated into a high and low group according to the median value of the bacterial abundance. Figure B shows the boxplot of the relative abundance of tumors and their adjacency normal tissues. Figure C and D show the boxplots of relative abundance of different groups in comparisons of the tumor samples, e.g., tumor stages and races. The message, "… has zero expression in all samples of …", appears if all the expressions of the queried bacteria are all zeros in the search cancer type. Additionally, if there are no adjacency normal samples in the queried cancer type, figure B will show "Not available" only. Slide, zoom in, save or reload the image by clicking the button in the individual plot. The table shows the statistical p-value of the comparing groups. Save the table by clicking Copy, Excel, or CSV button. 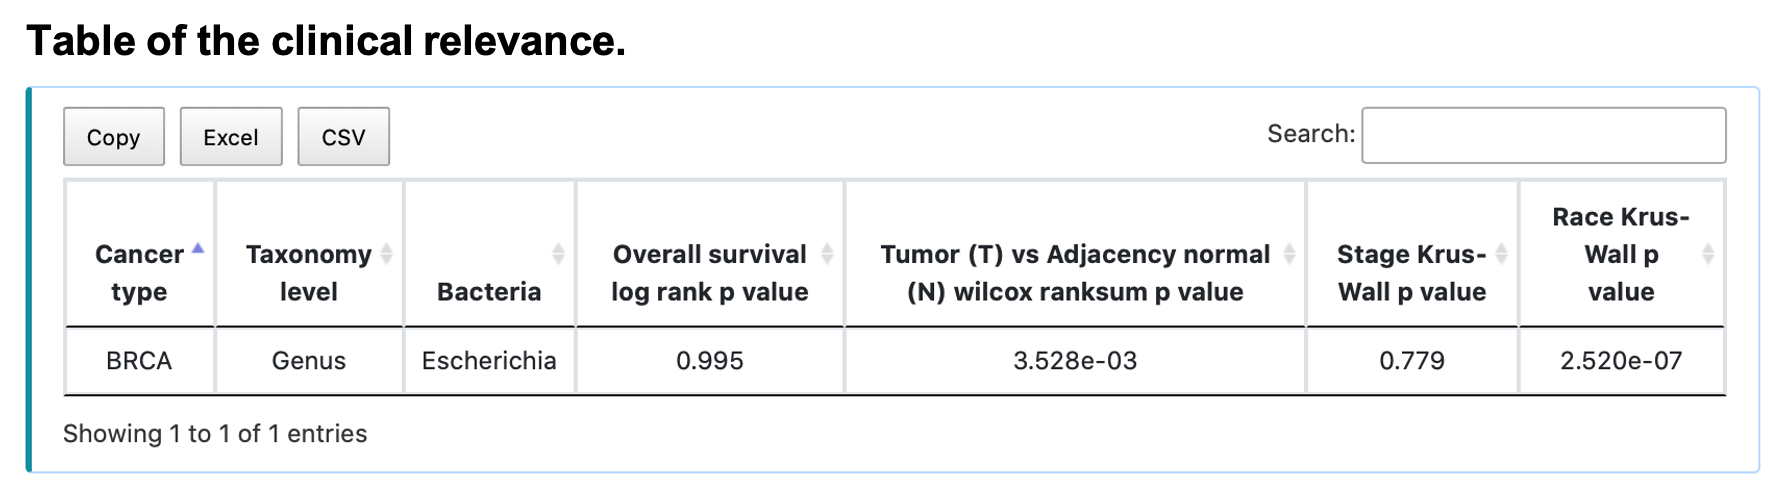
§ Bacterial co-abundance network
For the query:
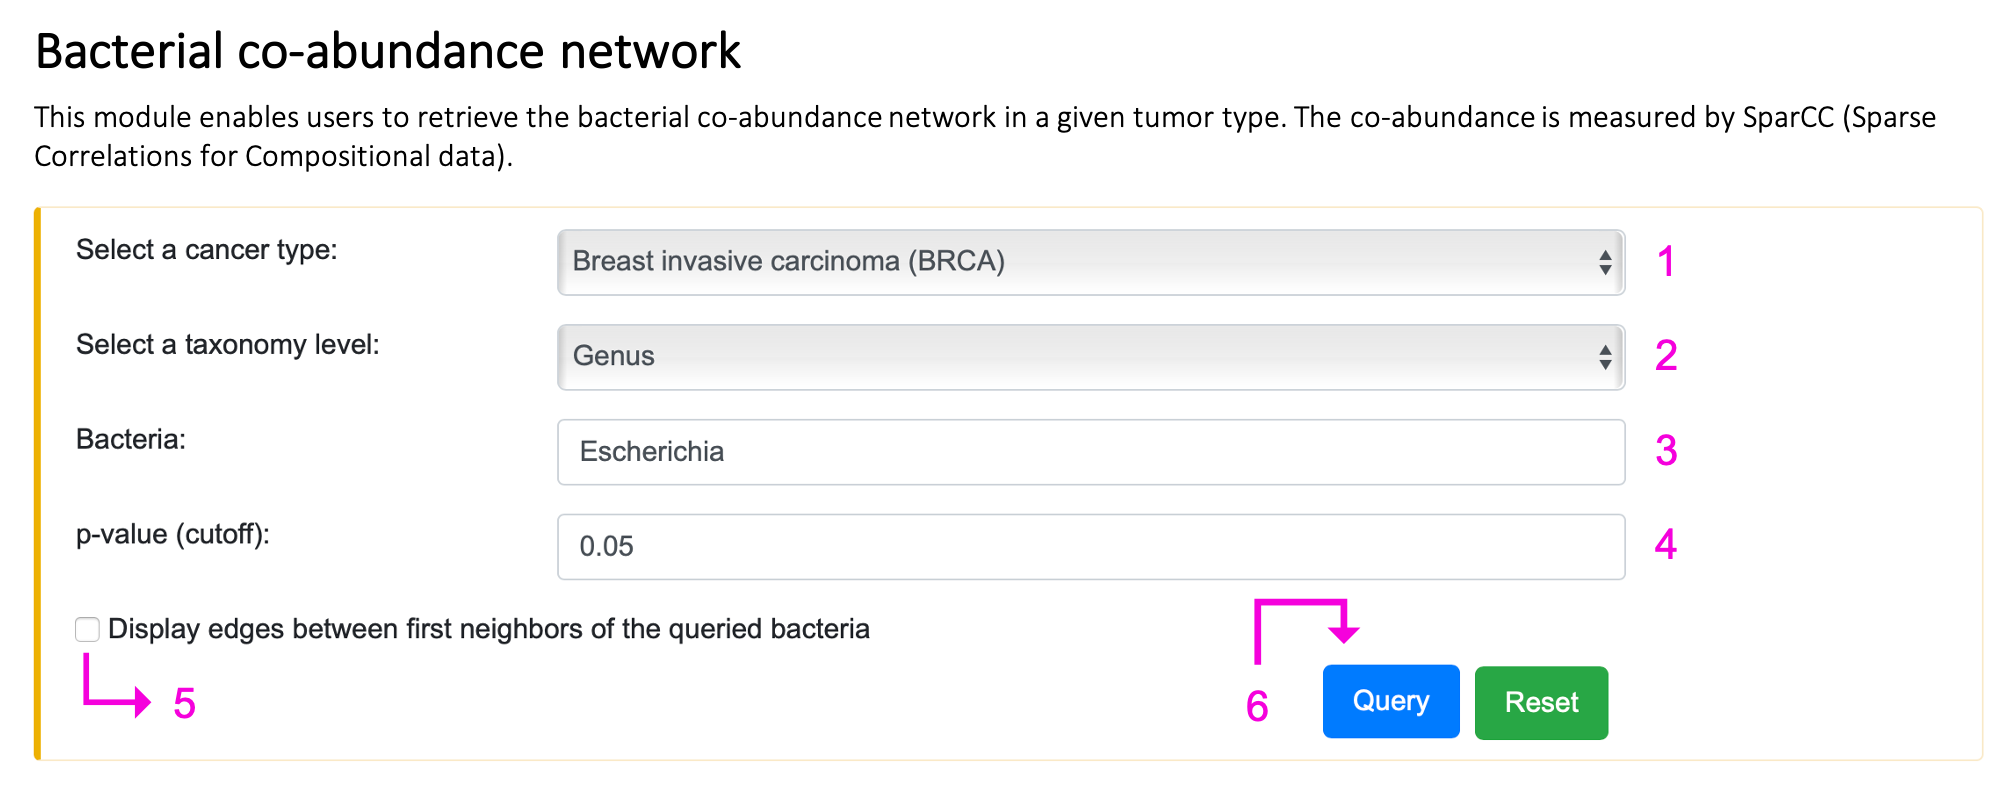
Step 1. Select the cancer type.
Step 2. Select the taxonomy level.
Step 3. Enter the bacteria name of interest. Autocompleted name list will popup if the bacteria existed in BIC. Otherwise, "Not available" will appear on 3 after clicking the query button.
Step 4. Input p-value should be in the range of 0 and 1. If the setting is out of range, the message, "0 ≤ p-value ≤ 1", will show up on 4. If the queried p-value is too low, no result will be returned, and the tip "Too stringent!!!" will appear on 4.
Step 5. Check the box if you want to see the edges between first neighbors of the queried bacteria.
Step 6. Click "Query" to get the result part.
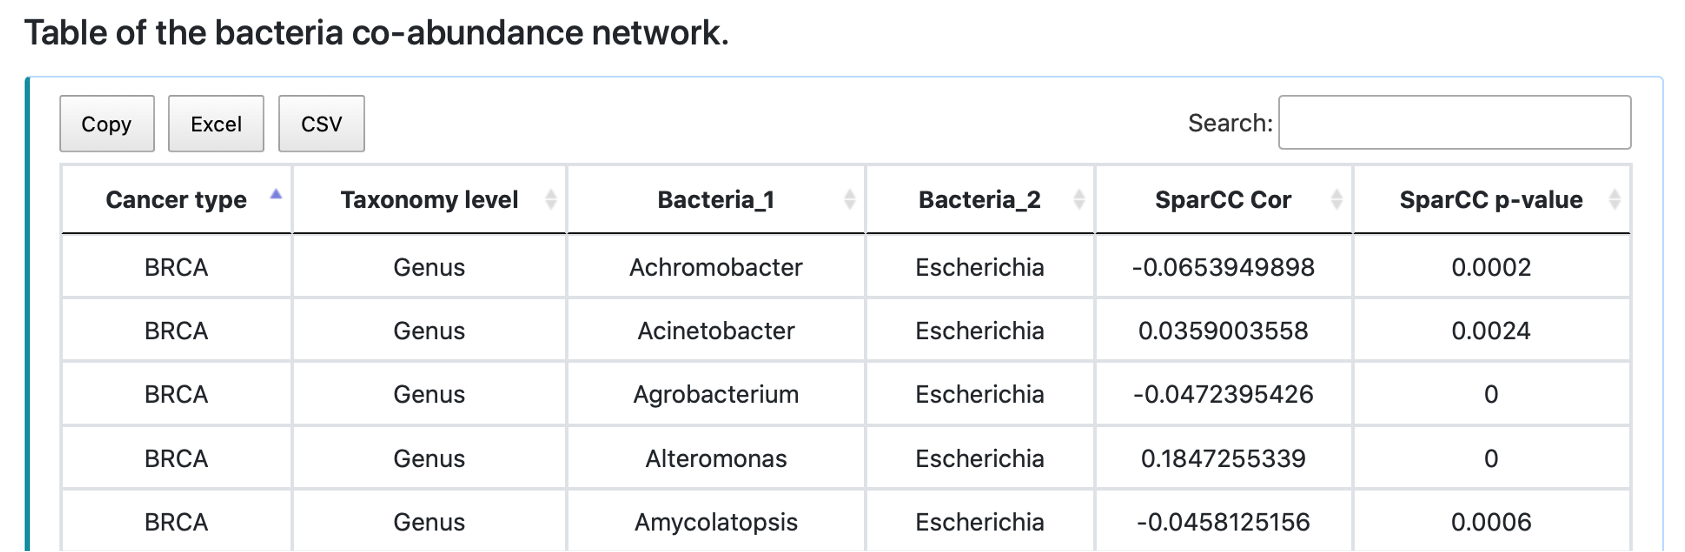
For the result:
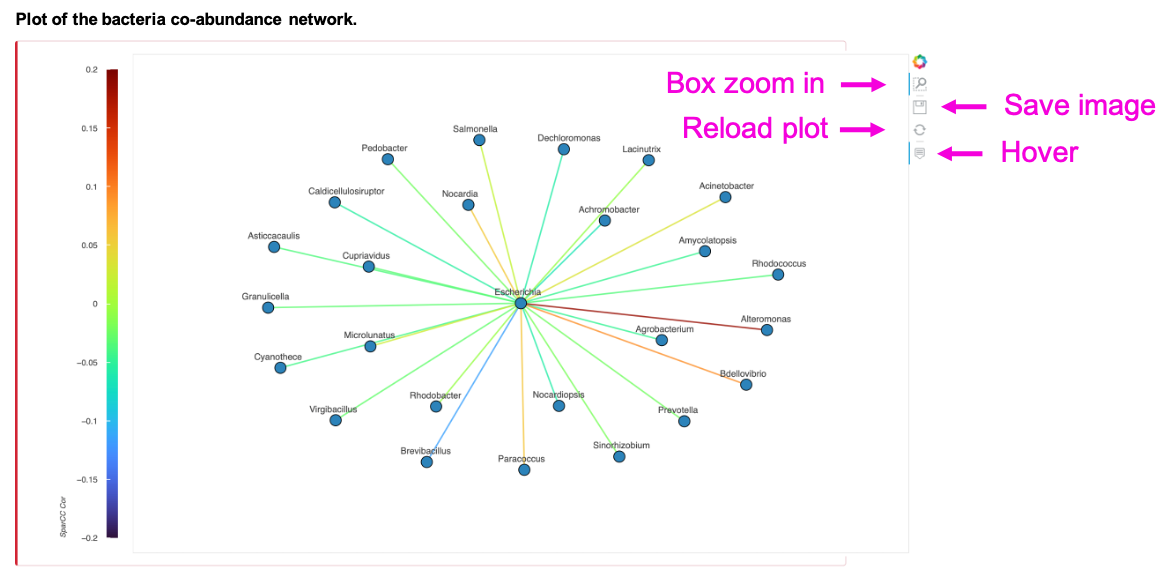
The network shows the SparCC correlation coefficients of the input bacteria, taxonomy, cancer type, and p-value cut-off. Zoom in, save, or reload the image by clicking the button in the individual plot. The table shows the statistics of the SparCC between input bacteria and its correlated bacteria under the user-defined p-value cut-off. Save the table by clicking Copy, Excel, or CSV button.
§ Bacteria-human gene network
For the query:
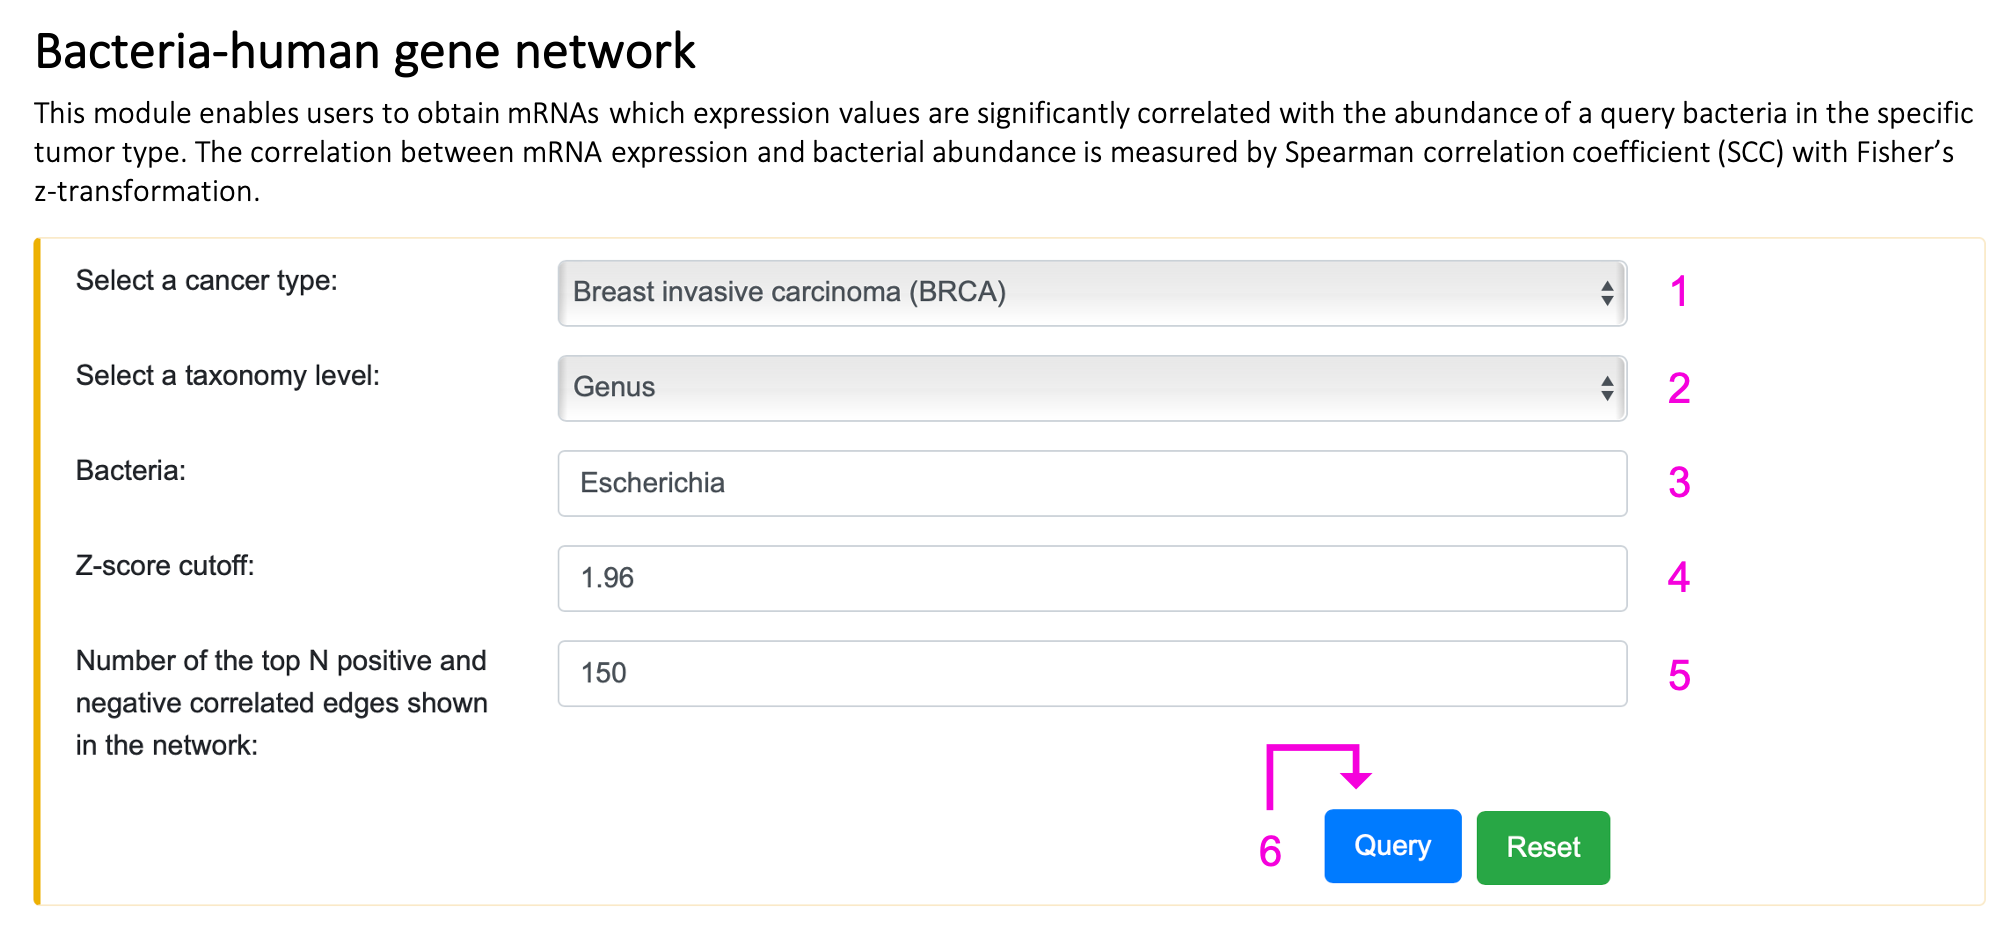
Step 1. Select the cancer type.
Step 2. Select the taxonomy level.
Step 3. Enter the bacteria name of interest. Autocompleted name list will popup if the bacteria existed in BIC human RNA network. Otherwise, "Not available" will appear on 3 after clicking the query button.
Step 4. Input z-score should be in the range of 0 and 20. If the setting is out of range, the message, "0 ≤ z-score ≤ 20", will show up on 4. If the queried z-score is too high, no result will be returned, and the tip "Too stringent!!!" will appear on 4.
Step 5. Input N positive and negative correlated edges should be between 1 and 200. If the setting is out of range, the message "1 ≤ N ≤ 200" will appear on 5.
Step 6. Click "Query" to get the result part.
For the result:
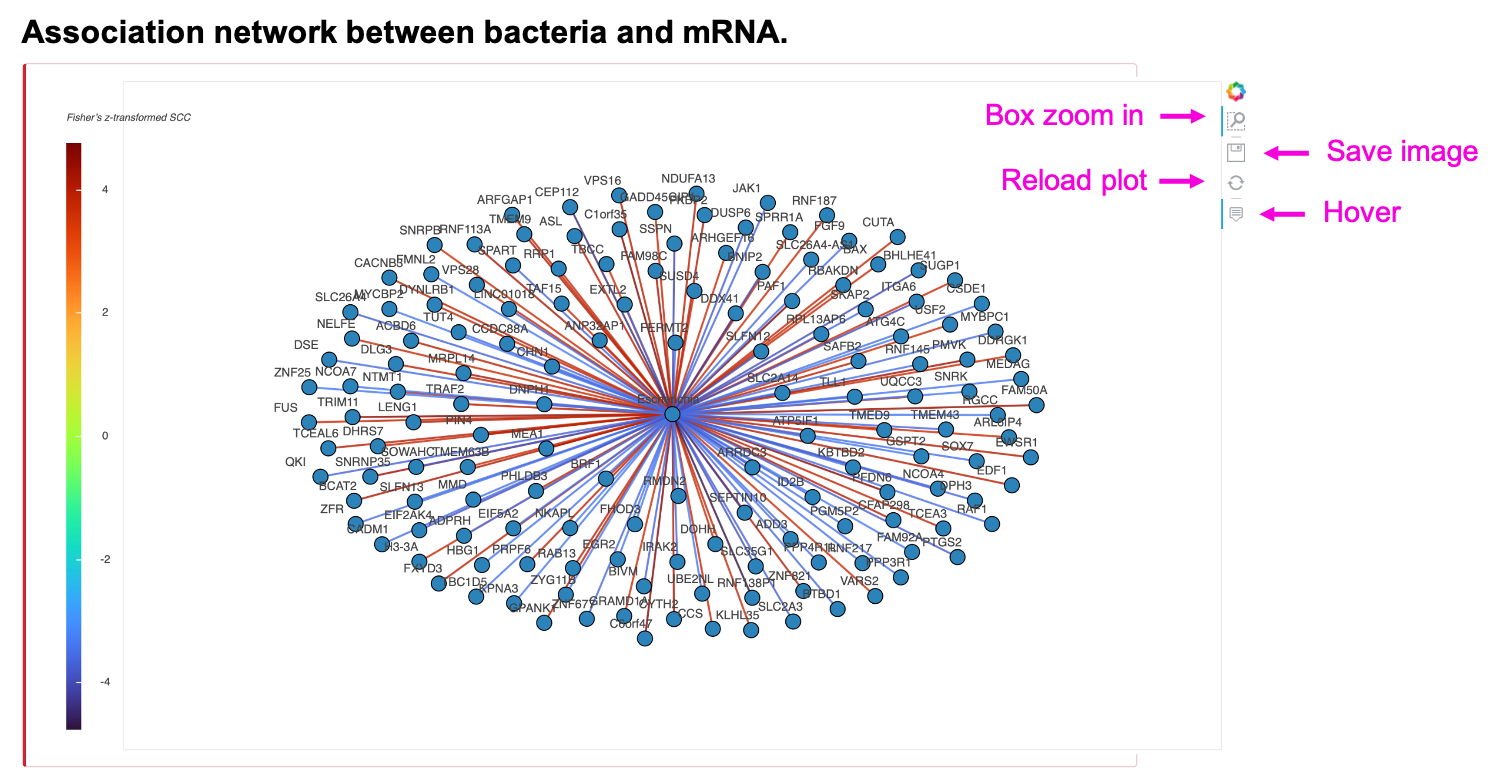
The network shows the Fisher’s z-transformed Spearman correlation coefficients (SCC z-score) between input bacteria and human RNA. To reduce plot complication, the maximal number of N positive and negative correlated edges is 200. Zoom in, save, or reload the image by clicking the button in the individual plot. The table shows all the pairs of input bacteria and human RNAs, and their SCC z-score, SCC, and SCC p-value rather than the limited N edges. Save the table by clicking Copy, Excel, or CSV button.

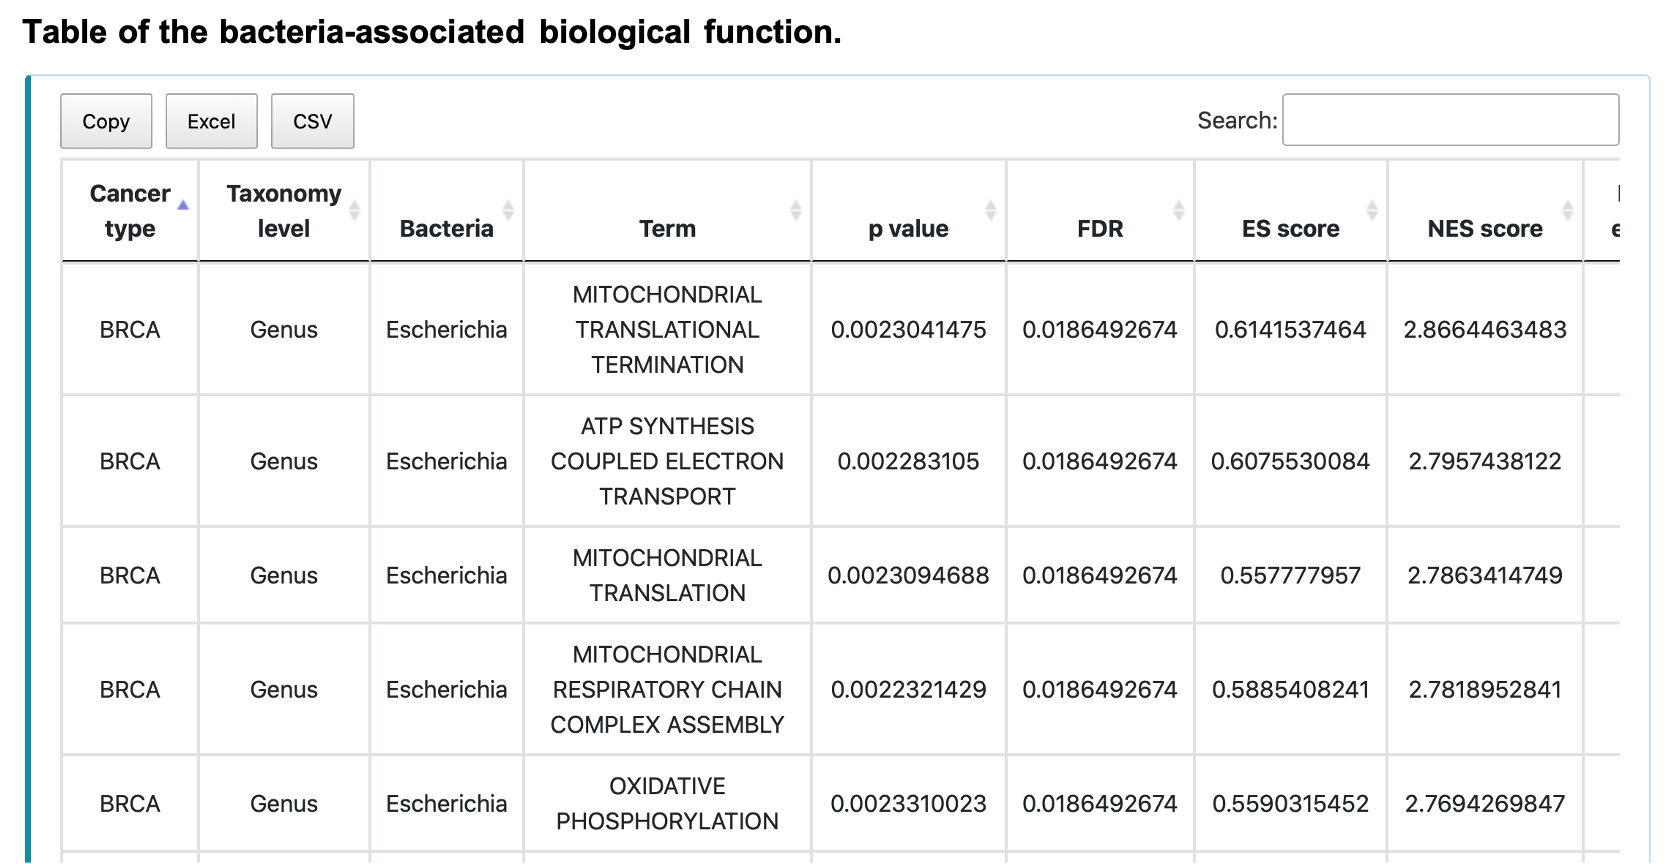
§ Bacteria-associated biological function
For the query:
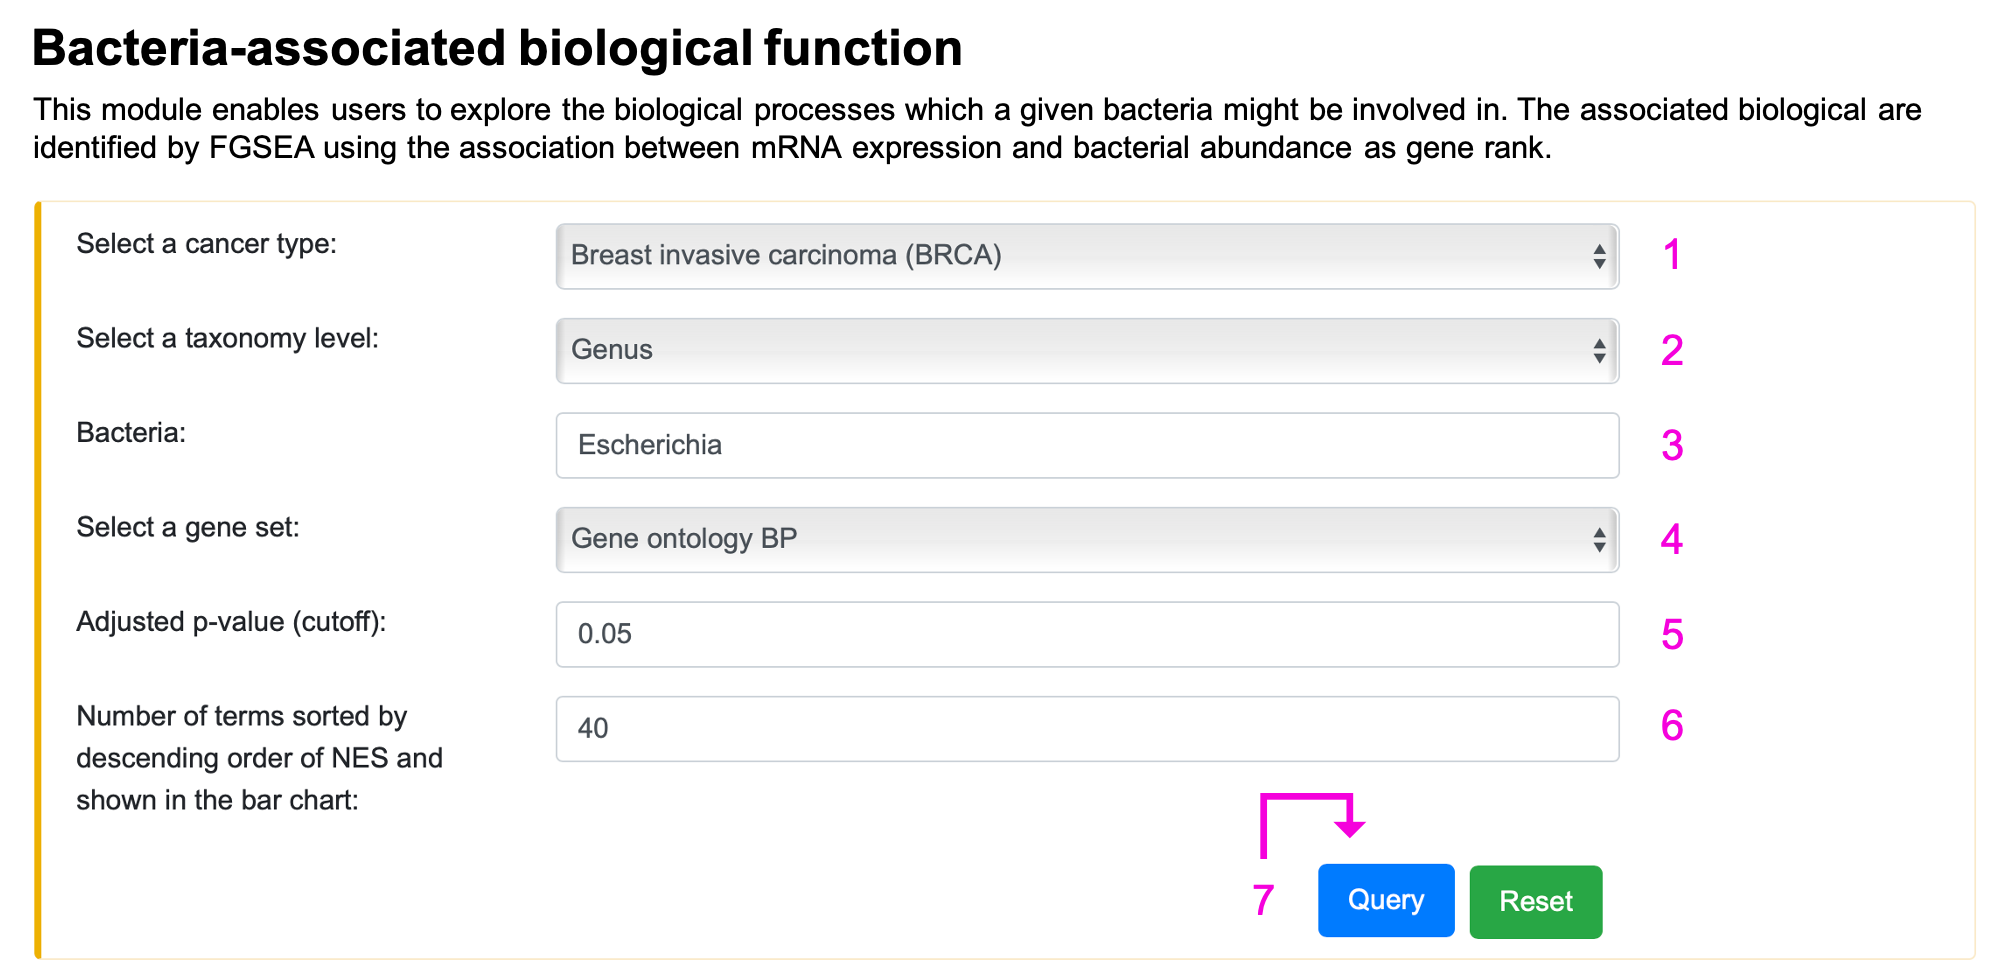
Step 1. Select the cancer type.
Step 2. Select the taxonomy level.
Step 3. Enter the bacteria name of interest. Autocompleted name list will popup if the bacteria existed in BIC human RNA network. Otherwise, "Not available" will appear on 3 after clicking the query button.
Step 4. Select a gene set.
Step 5. Input adjusted p-value should be in the range of 0 and 1. If the setting is out of range, the message, "0 ≤ Adj p-value ≤ 1", will show up on 5. If the queried adjusted p-value is too low, no result will be returned, and the tip "Too stringent!!!" will appear on 5.
Step 6. Input number of terms should be between 1 and 500. If the setting is out of range, the message "1 ≤ N ≤ 500" will appear on 6.
Step 7. Click "Query" to get the result part.
For the result:
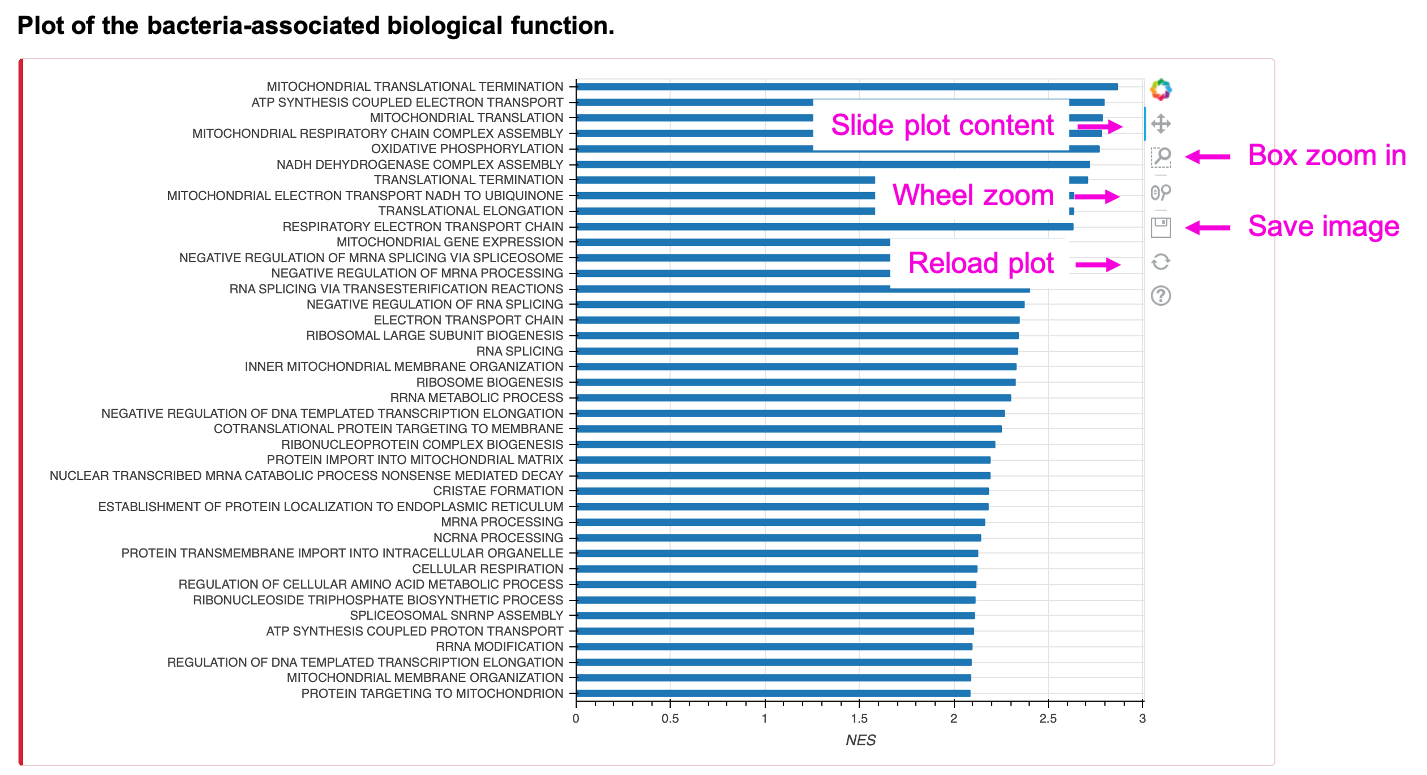
The bar chart shows the queried number (N) of biological function (Gene ontology BP/ KEGG pathway/ Reactome pathway) terms, sorted by descending order of NES, of the input bacteria, taxonomy, cancer type, and adjusted p-value cut-off. To reduce plot complication, the maximal number of N is 500. The table shows all the terms rather than the limited number. Save the table by clicking Copy, Excel, or CSV button.